A different way of looking at Steem inflation [burnsteem100]
I've mentioned before that Steem's daily production curve recently changed direction. The daily production of new STEEM rose for much of STEEM's history, up until about 2022. From 2022 to 2026, it was basically flat. Now, it entered a 3rd "era", where it will be shrinking at an accelerating pace until 2037.
One way I've described this is that Steem will go through two halvings between now and 2037, but the first halving is still years away, and I am an impatient person, so I wanted to look at things with shorter intervals.
First, let's look at historical STEEM daily production, where the downturn is already visible in the curve. In the last ~10 months, daily STEEM production already dropped by about 11/2% from about 93.1K to 91.7K.
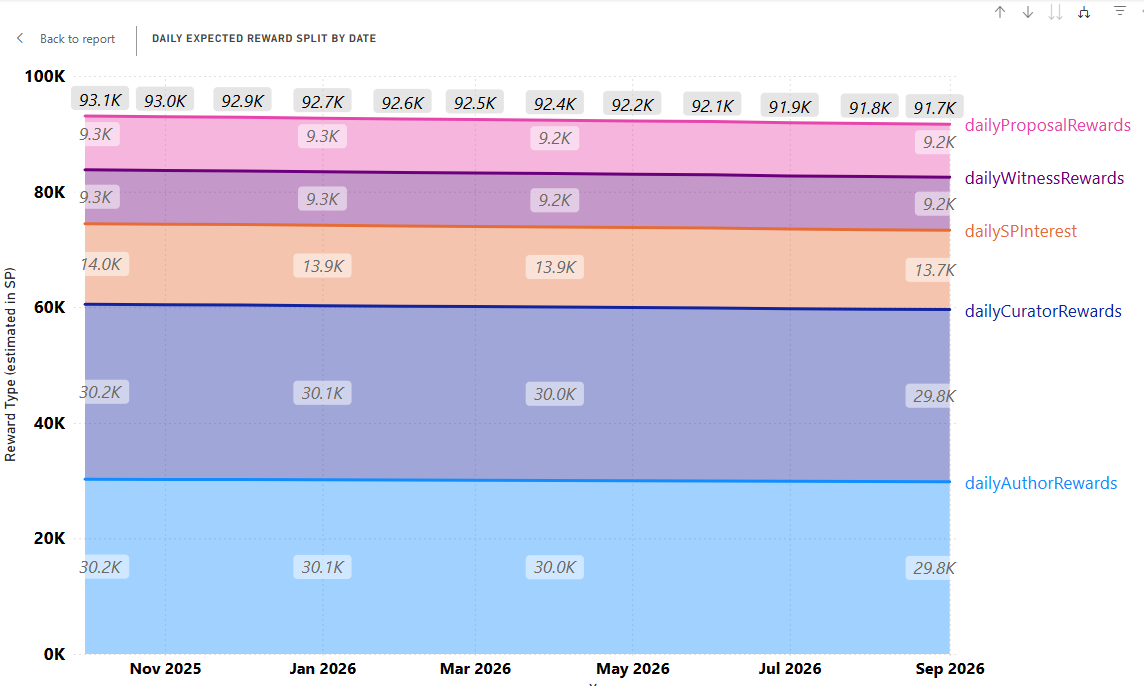
My expectation is that the downslope in that graph is going to get increasingly steep from now 'til 2037.
Next, and this is my new way of looking at it, let's see how long each 5% reduction will take from now 'til the end of the second halving (-75%). First the graph:
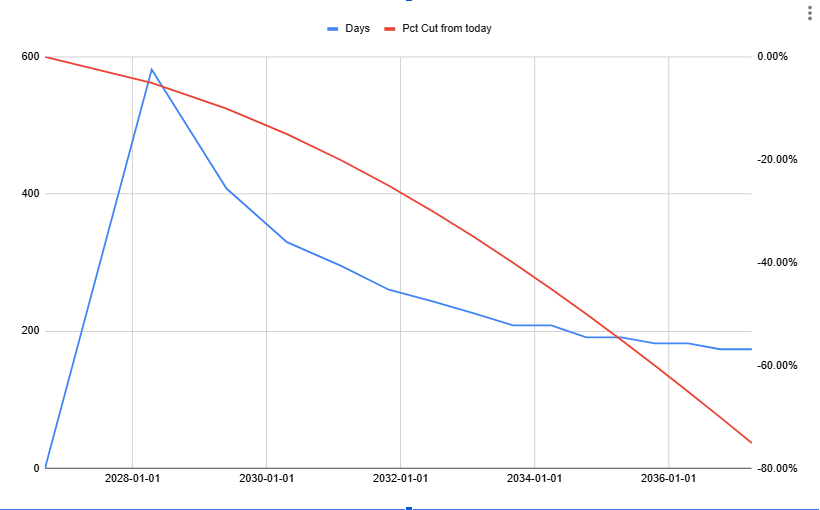
These numbers were collected yesterday, and I don't have an automated way to reproduce it yet, but the blue curve shows the number of days for every 5% reduction. Ignore the sharp up-trend at the beginning, that's just where the data starts.
What the blue line shows us is that each drop of 5% (based on today's value) takes less time than the previous drop - and the number of days between these "mile markers" gets reduced fast near the beginning of the curve.
This corresponds with the cumulative percentage reduction from 0 to -75% in the red curve, showing a somewhat gentle drop now getting sharper as time goes by.
Next the numbers:
| Date | # Days | New STEEM per day | Pct Cut from today |
|---|---|---|---|
| 2026-09-10 | 0 | 91,703 | 0.00% |
| 2028-04-13 | 582 | 87,080 | -5.04% |
| 2029-05-26 | 408 | 82,472 | -10.07% |
| 2030-04-21 | 330 | 77,934 | -15.02% |
| 2031-02-10 | 295 | 73,274 | -20.10% |
| 2031-10-29 | 260 | 68,710 | -25.07% |
| 2032-06-28 | 243 | 64,086 | -30.12% |
| 2033-02-08 | 226 | 59,493 | -35.12% |
| 2033-09-05 | 208 | 55,014 | -40.01% |
| 2034-04-01 | 208 | 50,319 | -45.13% |
| 2034-10-09 | 191 | 45,841 | -50.01% |
| 2035-04-18 | 191 | 41,209 | -55.06% |
| 2035-10-17 | 182 | 36,659 | -60.02% |
| 2036-04-16 | 182 | 31,996 | -65.11% |
| 2036-10-07 | 174 | 27,462 | -70.05% |
| 2037-03-30 | 174 | 22,851 | -75.08% |
So, the first 5% decline takes about 19 months, then about 13 months for the second, then every future 5% drop takes less than a year. The last one takes about 5-6 months.
This is just a projection, and there are any number of things that could shift the trajectory. There might also be errors in the calculations. However, this is my current expectation for Steem's future token production.
In summary, all this is just to say that I think Steem's future is likely to look increasingly different from its past, one block at a time, as time marches forward.